| Thomas Kepler Carson's Birth / 3-Contractions
in blue Nat Carson 9/5/2001 |
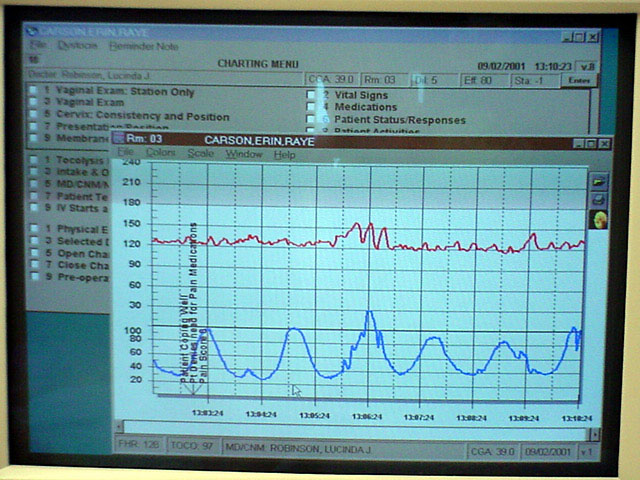
The Red Line is Thomas' heart beat. You can see that his heart rate hovers around 120 and went up to 150 during that contraction (shown in blue in the middle of the screen).
The Blue Line is the strength of the contractions. Looking at the graph you can tell that the contractions are coming at very regular intervals.
Other interesting information is that you can see the time stamp at the bottom of the screen (starting with 13:03:24). Each of the solid vertical lines is one minute. You can also see that Erin's doctor is "Robinson, Lucinda J."
Just before the 13:03:24 time mark the nurse entered in some notes: Patient coping Well; Pt [something] for pain medication; Pain Score 6 (measured from 1 - 10.)